> For the complete documentation index, see [llms.txt](https://tailieu.abaha.vn/llms.txt). Markdown versions of documentation pages are available by appending `.md` to page URLs; this page is available as [Markdown](https://tailieu.abaha.vn/quan-ly-modules/thong-ke/bao-cao-do-thi.md).
# Báo cáo đồ thị
Báo cáo đồ thị là một loại báo cáo sử dụng đồ thị để minh họa dữ liệu và phân tích. Đồ thị giúp biểu diễn các số liệu và mối quan hệ giữa các biến số một cách trực quan, dễ hiểu.
### 1. Hướng dẫn truy cập
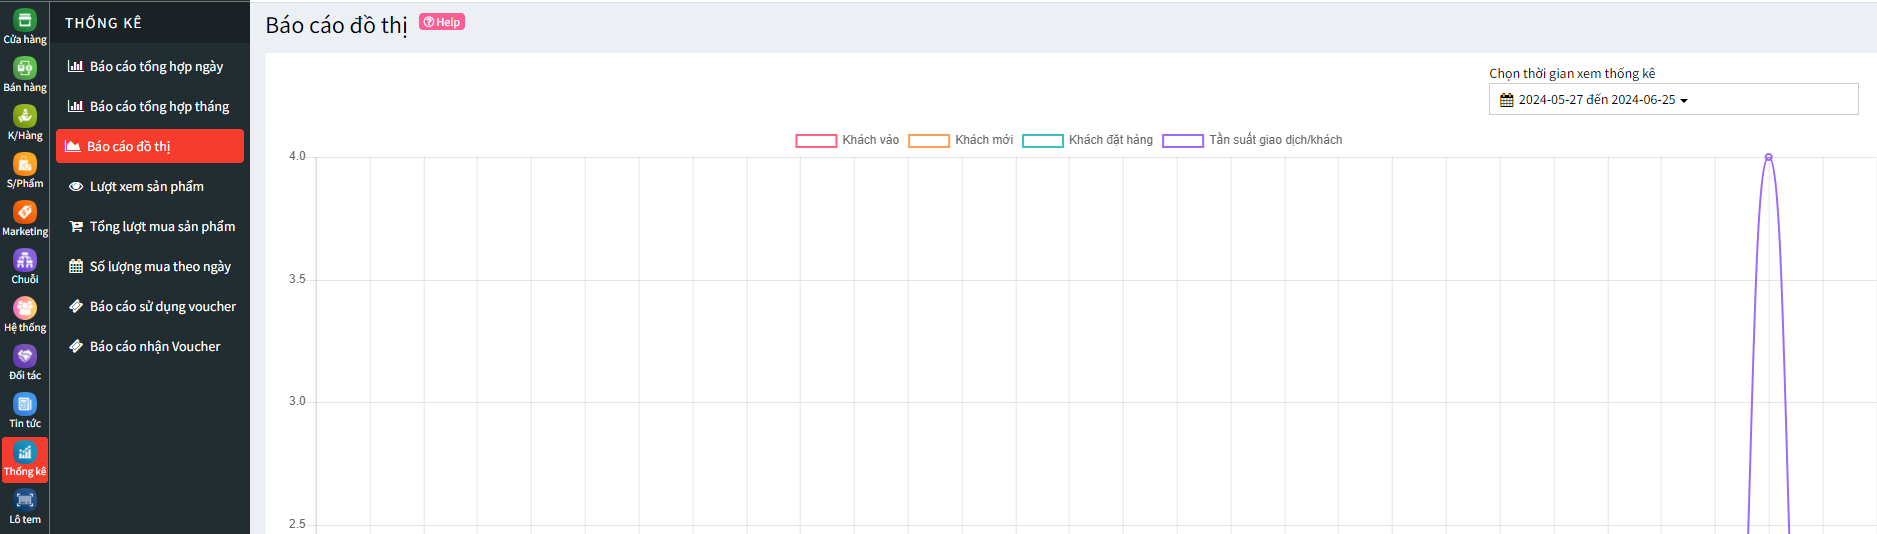
Tại Module Thống kê tại thanh sidebar bên trái chọn Báo cáo đồ thị để mở ra bảng báo cáo đồ thị.
### 2. Hướng dẫn xem báo cáo
Màn hình báo cáo đồ thị có thể hỗ trợ cửa hàng xem được nhiều thông tin quan trọng, giúp họ đưa ra quyết định kinh doanh sáng suốt hơn:
* Số lượng khách hàng mới
* Số lượng khách đặt hàng
* Số lượng khách hàng vào
* Tần suất giao dịch / khách hàng
* Số đơn hàng
* Giá trị trung bình/đơn
* Tổng giá trị
* Tổng số sản phẩm
* Số sản phẩm trung bình/đơn
### 3. Các hoạt động trong trang
Mặc định ban đầu thống kê theo thời gian là 1 tháng.
Chọn thời gian xem thống kê -> Apply, hệ thống sẽ hiển thị ra chi tiết các chỉ tiêu mà admin muốn xem báo cáo đồ thị.